Using the idea that a pigeon learns, and then attempts to follow a memorised `habitual route', we saw in the last post that we could use previously recorded flight paths to predict what future flights by the same pigeon, from the same release site would look like. We could assign a probability to any future path, thus deciding whether it was predictable or not after considering the past flights. The fact that paths typically became more predictable over successive flights was evidence that the pigeons were learning routes home and then sticking to them.
But how does a pigeon learn a route home. It is unlikely that it imagines a perfect line on the ground below it, representing some kind of idealised route it wants to follow. Memorising a complete continuous path, which has an infinite number of locations along it, is hard. Instead, the generally accepted hypothesis is that a pigeon learns its route by memorising a small number of landmarks which act as waypoints. This idea, known as `pilotage', supposes that the bird reaches one landmark, then reorients itself to head for the next until it reaches home.
Can we detect where these landmarks are, using the methodology we've developed so far? Of course we can!
Recall that we previously assumed that a flight path always consisted of 100 recorded positions, starting at the release point and ending at the home loft. We predicted future flights by using these 100 points on each flight path to estimate a habitual route that the bird was trying to follow. We predict that future flights will also look like this habitual route, plus some variation that changes from flight to flight.
In principle we can choose to ignore some of this data. We can, if we want, choose to estimate the habitual path using only a subset of the data we have. For example, we might choose 10 random points of the 100 we have of each flight, then try to estimate the habitual route from these.
The first important point to understand for identifying landmarks is that such an approach will have varying degrees of success, depending on which points are selected. Consider the figure below
In each case the faint black line is the same simple bell curve. The black dots indicate 3 points on this curve that we are "allowed" to know in order to make a guess what the whole curve looks like. If we draw a smooth line through these three points we get the two red lines. Hopefully it should be clear that the red line on the left is a much better estimate of the bell curve than the very low red line on the right. Therefore, if I wanted to remember 3 points to try and remember the whole of the faint black line, I would better off choosing those on the left, rather than those on the left
But this is exactly what the pigeon has to do! It needs to remember a few landmarks so it can remember the whole of its route home. This suggests the second important point for identifying landmarks: the points that allow best estimation of the habitual route are the same points as the pigeon's landmarks. That means that we assume the pigeon does a good job of choosing the most efficient way to compress its habitual route into a few key points.
Since we can never measure exactly how well we have estimated the habitual route, we do the next best thing and test how well any set of possible landmarks allows us to predict future flights. If we call the subset of times that correspond to landmark locations at t_lm, and the full set of times as t_full, then our task is to choose t_lm to maximise p(x_n+1(t_full) | x_1(t_lm), x_2(t_lm), ..., x_n(t_lm))
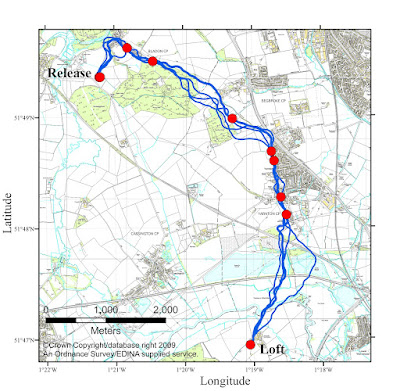
And when we do this, we find landmarks that correspond to recognisable features of both the paths and the landscape beneath, such as below (remember I promised to explain what those red dots were...?)
The landmarks (the red dots) tend to be where the paths are very similar, since here the paths are a very good predictor of the habitual route, where the pigeon flies somewhere unexpected - the apex of the `C' shape - and where the path curves sharply. They also tend to be on the edge of forests and villages, above major roads and obvious features such as a church spire.
[NB: Those with a machine learning background may see that this process is largely analogous to two other ideas. Active sampling, where we take data in an intelligent way to maximise our predictive power while minimising collection costs, and reduced rank Gaussian process approximations, where we use a subset of data points as `inducing points' to create a lower rank covariance matrix and speed up calculations.]


No comments:
Post a Comment