Friday, August 5, 2016

A few fascinating laws and paradoxes

I recently spent an evening discussing the time-reversibility in Newtonian mechanics through the medium of 140 character tweets, after being introduced to one of my favourite things: a new paradox (hat tip to @MikeBenchCapon). This reminded me that there can be no excuse to be bored in this day and age when you can spend happy hours perusing the lists of eponymous laws and of paradoxes on Wikipedia. Here are a few of my favourites eponymous laws from those lists and elsewhere:

Benford's law: on the power-law distribution of specific digits in naturally occurring statistics.  The most commonly quoted part of the law is that about 30% of all statistics will start with the digit 1, compared to a naive expectation of around 11%. This law was used to show that Iran had been fabricating data relating to its nuclear program, since the digits in the data did not follow Benford's law. My favourite aspect of the law is that it can be derived from the assumption that if there does exist a distribution for the digits, it must be independent of the numerical basis used to represent the statistics.

Baumol's cost disease: why the cost of doctors, teachers and other service professionals increases over time. The efficiency of manufacturing has historically progressed faster than service sector occupations such as health care and education, through mechanisation. Instead of raising the salaries of manufacturing workers faster than service workers, all salaries tend to grow at roughly the same rate. As a result, labour-intensive industries become more costly over time relative to the price of manufactured goods. Expect tuition fees to carry on rising.

Goodhart's law: why you can't measure how well an intelligent system performs if you reward it for that performance (see also Campbell's law). Academics will be familiar with the gaming of league tables and the UK Research Excellence Framework by their institutions. When a body such as the government decides on metrics as a proxy to measure performance, and then rewards those who perform well by these measures, individuals choose to target the measures rather than genuinely improving overall performance. Hence we get teachers teaching-to-test, universities gaming the REF, scientists prioritising citations over true advances, and hospitals playing games with patient waiting times.

And of course Stigler's law of eponymy, which states that these laws were probably not named after the people who discovered them first. Stigler was, of course, not the first to propose this.

Here are a few of my favourites paradoxes, along with a rating for how genuinely paradoxical they seem to me:

Berkson's paradox: why the best-looking people you date have the worst personalities. While beautiful people may be no more or less pleasant in the population as a whole, you will let a bad personality slide for a beautiful mate, or date someone below your usual standards of physical beauty if they have a sparkling wit. As a result, in the group of people you date there will be an inverse correlation between beauty and personality. Paradox rating 1/10

The friendship paradox: why your friends probably are more successful and have more friends than you do. It is a simple result of networkm theory that you are most likely to be friends with people who have lots of friends, since they have more friendship links available. This means that a typical person is connected to people who have more friends than they do (while a few individuals are connected to lots of people with fewer friends). A simple corrolary is that if more successful people have more friends, then your friends will, on average, be more successful than you. In science, this selection effect is why everyone you know seems to be doing better than you are - the better they are doing, the more likely you are to be aware of them. Paradox rating 3/10

The envelope paradox: how a simple game tests the bounds of probability theory. A game show host offers you two envelopes and tells you that one contains twice as much money as the other. You open one envelope and find it contains £10. The other must contain either £5 or £20, with an average of £12.5. When the host offers to let you switch it seems that you should. But that choice would have been the same if you had never opened the envelope. The next time you don't even bother to open the envelope before switching, but now the same logic applies to the new envelope, making you switch back and forth forever. What has gone wrong? Paradox rating 7/10

Norton's dome: Theoretical departure from causality in Newtonian physics. A point mass sits atop a radially-symmetric, frictionless dome, with no force acting on it. After some arbitrary amount of time it begins to move spontaneously and rolls down the side of the dome. Its motion nonetheless obeys Newton's laws at all times, despite there being no way to predict, or even place probabilities on, the time elapsed before it starts to roll. Paradox rating 9/10

Monday, July 18, 2016

Will your job be automated? A critique of the predictions of Frey and Osborne

You cannot have failed to encounter the current hype and/or panic about job automation. The basic story is compelling. Drawing on the availability of Big Data, artificial intelligence is progressing at a breakneck speed, solving problems that once seemed like science fiction: driverless cars, recognising people in photos, giving eerily accurate suggestions about which films we might want to watch or even what email replies we might want to give. More mundane tasks that were once the preserve of highly-trained professionals are also at risk, such as legal research. A computer can scan millions of legal texts for relevant information while a lawyer is still finding the reference for the text they need.

All of this has led to a widespread belief that many people face the loss of their job in the near future. Of course, automation has been with us since the industrial revolution, and in some areas even before then. Resistance to, and despair about automation is as old as automation itself. But the new panic is about the possible scale of job losses, and the lack of useful employment opportunities for those displaced. An oft-quoted figure is that 47% of U.S. jobs are at risk of automation.

The figure of 47% originates in the work of Carl Frey and Michael Osborne, of Oxford University. Frey and Osborne persuasively argue that the progress in data collection, data analytics and artificial intelligence puts many tasks that were previously thought to be out of reach for computers and robots within touching distance of being automated. They contend that advances in pattern recognition mean that computers, which previously had been used to automate routine tasks, such as performing repeated calculations or fitting parts together in factories, will increasingly be able to tackle non-routine tasks. For example, Siri and similar artificial personal assistants take in unstructured voice requests and determine what the user wants, where to seek the required information and how to present it to them. With enough data, they suggest, almost any task can be automated by looking for patterns in the data that inform the task at hand:

"...we argue that it is largely already technologically possible to automate almost any task, provided that sufficient amounts of data are gathered for pattern recognition." [F&O]

These arguments are persuasive, and there is no doubt that modern machine-learning research has made great strides - it is worth trying to recall how outlandish some of today's AI technologies would have seemed just 10 years ago. Nonetheless, others such as Neil Lawrence, of Sheffield University, have argued that relying on huge data sets in this way is not the same thing as true artificial intelligence. Only a few organisations in the world such as Google and Facebook have access to truly vast amounts of data about our daily behaviours, and a great deal of their research is dedicated to targeting adverts at us with increasing precision. Moreover, if a computer needs a vast data set to learn what it should do, how readily can it adapt to new tasks? Will there always be a big enough relevant data set that has, or even could be collected? What about tasks where the computer may not have access to 'the grid' and the vast centres where data is stored? These are big questions that drive significant bodies of research in AI. Given these uncertainties, it is worth considering how F&O arrive at the rather precise number of 47% for the proportion of jobs at risk.

Fittingly enough, F&O use machine-learning itself to determine whether a job is automatable. They use a tool called Gaussian process classification (GPC) to predict whether a job is automatable, based on the characteristics of that job, as defined and measured in a data set called O*NET, collected by the US Department of Labor. O*NET lists the skills and knowledge required to perform each job. To use GPC to make predictions requires two things, a set of predictors (in this case the O*NET data) and a matching set of known outputs on which to train the classifier. In plain terms, they require not only the job characteristics, but also, for some of these jobs, a known risk of automation. Where does this second part come from? In short, they make an educated guess (or more precisely, they ask a group of well-informed people to make such a guess). In the paper they describe this process:

"First,  together with a group of ML researchers, we subjectively hand-labelled 70 occupations, assigning 1 if automatable, and 0 if not. For our subjective assessments, we draw upon a workshop held at the Oxford University Engineering Sciences Department, examining the automatability of a wide range of tasks. Our label assignments were based on eyeballing the O∗NET tasks and job description of each occupation. This information is particular to each occupation, as opposed to standardised across different jobs. The hand-labelling of the occupations was made by answering the question “Can the tasks of this job be sufficiently specified, conditional on the availability of big data, to be performed by state of the art computer-controlled equipment”. [F&O]

To make the process plain, they took 70 of the jobs in the data set about which they were most confident, and made their best guess as to whether these were going to be automated. They then use the GPC to translate these subjective opinions about 70 jobs into predictions on the other 600 or so in the data set. Essentially they train the GPC to learn what it is about certain jobs that makes them believe they will be automated. Ultimately then, the GPC propagates this subjective opinion to all the other jobs, and determines that 47% are predicted to be automated.

As a side effect, the GPC is also able to identify the factors that seemed to influence whether the workshop participants thought a job would be automated. The factors identified seem reasonable: jobs requiring high social perceptiveness have a low risk for example. But we should perhaps treat these findings with care - the very fact that they seem reasonable to us suggests that they also seemed reasonable to the people making the predictions - no wonder then that they labelled jobs requiring high social perceptiveness as less likely to be automated. Moreover, while the participants of a workshop at the Oxford University Engineering Sciences Department no doubt have greater expertise than the average person in determining the capabilities of machines, we should also be aware that such groups are somewhat selective to technological optimism - few people choose to become researchers in artificial intelligence if they do not believe it is important, any more than you would become a teacher if you didn't think education made a difference. Any biases or blind spots these individuals might have will be translated into the final figure of 47%, as well as the characteristics chosen as most important.

There is a danger when reading the paper (if one does, no doubt many news sources do not), that one can be impressed by the mathematical sophistication of the GPC prediction machinery. It is an impressive piece of technical work. But the GPC can only work with what is is given - it generalises from known examples in the data. The old saying about computer science: 'garbage in, garbage out' is overly pejorative here - the predictions the GPC has been trained on are not garbage, but the best educated guesses of well informed people. They are internally consistent - the GPC can predict well the predictions made by workshop participants for unseen examples. But the GPC cannot predict more accurately than the individuals themselves. It is important to realise that the trained-GPC is effective a machine for making the predictions these same individuals would have made themselves if they were asked. With all the uncertainties involved in a still nascent and quickly changing field, making precise predictions is extremely speculative. Just imagine how different many of these predictions would have been if people had been asked 10 years ago. What might they look like in 10 years time?

All of this makes me very skeptical about the now ubiquitous assumption that masses job losses are inevitable. In many ways I hope they are - we should hope that more of the tasks we only do out of necessity will be automated, as long as the economic gains can be spread equitably (a whole other ball game!). But a narrative of huge disruption feeds into the rather millennial milieu in which we find ourselves, plagued with doubts about our economic system, possible catastrophic climate change, antibiotic resistance etc. It is very tempting to believe that disruptive, destructive change is now a permanent feature of our lives. F&O, to their credit, do not take this line - I have seen Michael Osborne present his work previously and he speaks to all great possibilities automation creates. It is also worth noting that many tasks that can be automated take an amazingly long time to be so. I recently took a trip to the National Coal Mining Museum, where I was amazed to learn that very few mines had any serious machinery involved in the actual hacking off of coal until nationalisation and unionisation drove up labour costs and pushed efficiency up the agenda after the war. I'm perpetually amazed, as a renter, how many people think dishwashers are optional! As Frey & Osborne note, but few news outlets pick up on, automation will only happen if the cost of labour is sufficiently high - many government policies are directed explicitly at lowering the cost of labour to the employer.

We shall no doubt see feats of automation in our lifetimes that would stagger us today, just as the household appliances created in the 20th century would amaze our ancestors. But exactly which jobs will disappear, when they will do so and how many people will become unemployed? I would not want to guess.

Reference: [F&O] The future of employment: How susceptible are jobs to computerisation? Carl Benedikt Frey and Michael A. Osborne
   

Wednesday, July 13, 2016

Brexit: a statistical demographic analysis

Britain voted for Brexit, defying the predictions from Betfair's prediction market. I was in the US at the time, giving me the dubious privilege of watching the votes come in without having to stay up all night. As a (relatively) young, (relatively) affluent graduate and resident of a major UK city you will be completely unsurprised to learn that I voted to remain.

There has been a lot of discussion in the press since the vote regarding different demographic splits between remain and leave voters. We are told that city-dwellers, graduates, the young and the affluent tended to vote remain, while poorer voters, those in small towns and villages, those without higher education and older voters tended to vote leave. The Scottish and the Irish voted in, the English and the Welsh voted out. The Guardian provides a breakdown of these trends, which appear to show a nation divided. I assume the data they use comes from the 2011 UK Census.

In an effort to channel my increasing angst in a positive direction I set out to do a more thorough statistical analysis of the data The Guardian presented to identify which demographic factors were most important in determining how people voted. After scraping the data from the Guardian website I first reproduced the graphs The Guardian had displayed (see end for scraping details. NB: I could have aggregated data from the UK Census directly, but this was quicker and ensured I was using exactly the same measures as the Guardian). My demographic data are all in arbitrary units since I had to scrape the values in pixel units from the webpage, but since this won't affect the statistics I wish to do - in fact, scaling each demographic variable to lie between 0 and 1 helps us to compare the magnitude of effects. On each subplot I have given the correlation coefficient between the demographic indicator and the proportion of leave voters.

 In short these plots (working left to right and top to bottom) seem to indicate that:
  1. Voters with degrees tend to vote remain
  2. Voters with no formal qualifications tend to vote leave
  3. Voters with higher incomes tend to vote remain
  4. Voters in the ABC1 classes tend to vote remain
  5. Older voters tend to vote leave
  6. Voters in areas with more non-UK born residents tend to vote remain
So far, so much in agreement with the general terms of discussion. How do these perceptions hold up when we actually do some statistics on the data?

The tool I used for this analysis is the Generalised Linear Mixed Effects Model.  I specified the model as:

proportion voting leave ~ (1 | Region) + proportion with higher education. + proportion with no formal qualifications + median income + proportion in ABC1 social classes + median age + proportion not born in UK

This model states that the proportion of leave voters in an electoral area is determined by the demographic characteristics plotted above, but with regional variations specified by the random effect (1 | Region). We know that each nation of the UK had distinctly different voting patterns, quite separate from their different demographics, e.g. older voters in Scotland didn't necessarily vote the same way as similarly-aged voters in England. We'd better account for this in the analysis if we want to identify the real underlying effects.

Running this model in R (lme4::glmer, scaling the independent variables to have zero mean and unit standard deviation) we infer estimated effect sizes for each of the demographic variables. Below I've listed these and plotted the effect sizes with 95% confidence intervals for visual comparison. Points plotted to the left of the vertical grey line indicate a negative affect on the leave vote, those on the right a positive effect.


Some of the initial impressions from the data are born out in this analysis. The intercept is weakly positive, indicating that overall the nation voted to leave (albeit by such a slim margin that the intercept is not significantly greater than zero! - worth noting by those claiming an uncontestable mandate). By far the most important predictor of how an individual will vote is whether or not they have had any higher education. Older voters do tend to vote leave in greater numbers (in fact this tendency is shown more strongly here than we saw in the first set of plots). But some of the other results are surprising. The proportion of residents who are not born in the UK has a negligible effect on how that area will vote. Class has a relatively weak effect despite showing one of the strongest correlations. Voters with higher incomes are more likely to vote leave (all other things being equal). Perhaps most surprising, areas where more people have no formal qualifications are substantially less likely to vote leave (again, all other things being equal). The strong positive correlation seen between proportion with no formal qualification and leave vote seen in the first figure appears to be a side effect of the strong anti-correlation between the proportion with no formal qualification and the proportion with higher education. 

Of course, that caveat all other things being equal is doing a lot of work. Its rare to find someone with a high income, but with no higher education and who would not be classified as being in the ABC1 social classes. Likewise there are not many areas where there are simultaneously a large number of graduates and a large number of people without formal qualifications. Nonetheless, the differences between the statistical results and the original impression from the data plots should make us pause before reading too much into the apparent demographic trends.

This analysis was a simple effort with a readily available model - hopefully some more sophisticated analysis will reveal a clearer picture. In particular, including interactions between these different indicators may give better predictions. As usual in such analyses, we should be aware of all the caveats surrounding ecological regression - data based on individual characteristics would be preferable, but that may be a pipedream.

How I got the data: scraping, xml and awk

The Guardian is one of the best newspapers in the world for presenting real data and analysis to the public. That it is free to access is an amazing privilege for those of us who are interested in the real evidence behind the headlines. It regularly presents beautiful summaries of important data in an easily understood format. 

However, on this page where the demographic data is plotted, there is no information on how one might view the original data is numerical form. That is the newspaper's prerogative, and may be due to worries that other publications would piggyback on the hard work Guardian journalists do in finding the information. It does however make Open Science difficult.

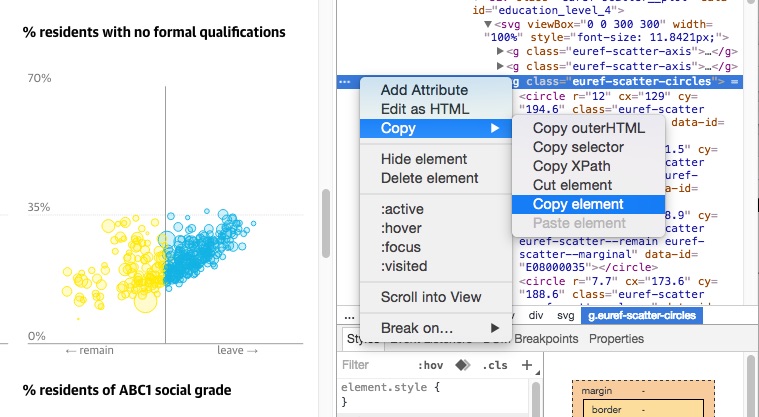
To get the data I needed I first inspected the elements comprising the interactive plot (in Chrome, right click: inspect)


Then I found the xml entries that gave the screen coordinates for each circle plotted on each graph


I copied this element, which specifies the location of each circle and, thankfully, a code for the electoral area, into a text file, getting text that looks like this:


To get the raw x, y positions for each circle I processed this text file using an awk script (credit for awk-ing goes to Roman Garnett). Using an xml processing tool may be more efficient (or at least more sensible).

awk 'BEGIN {RS="<"} /^circle/ {gsub("[[:punct:]]", " "); gsub("data id", "dataid"); for (i = 1; i <= NF; i++) {if ($i ~ "cx" || $i ~ "cy" || $i ~ "dataid") {printf "%s ", $(i + 1)}} printf "\n"}' input_file >> output_file

I rescaled these data so that every demographic indicator lies between 0 and 1, and then matched these data with far more easily obtainable data on how each electoral area voted from The Electoral Commission. (NB: the raw numbers are inverted in scale when collected from the website, because they indicate pixel positions from the top of the graph element.)

I am a little uncertain on whether one should make this data openly accessible. On the one hand the raw numbers I used are all publicly accessible on The Guardian's webpage (with a bit of work!), and could in principle be retrieved from the UK Census. On the other hand The Guardian didn't publish the numerical data, and so I will respect that and not do so here. These instructions should be sufficient to allow you to get the data yourself should you wish, and I would suggest contacting The Guardian if you want to do anything remotely commercial with them.


Sunday, June 19, 2016

Predicting the Brexit vote from the betting market with R

There is currently an intriguing (one might say terrifying) mismatch between the many opinion polls on the coming EU referendum and the betting markets. The poll analysis website http://whatukthinksthinks.org /eu presents a 'poll of polls' that puts Remain and Leave neck and neck at 50%-50%, but on betfair.com the implied probability of a remain vote is (as of 12pm on June 19) 70%.

Tight polls don't necessarily mean the outcome is uncertain. If every poll gave Remain 51% and Leave 49% then we could be quite confident that Remain would win - they only need 50% + 1 vote. When the vote arrives, if 51% say Remain then we can be 100% sure that Remain has won.

But how to compare directly what the polls and betting markets think? The main betting market indicates the probability that Remain or Leave will win, not their respective vote shares. But in a sub-market one can bet on the vote shares themselves, generally in 5% intervals. Using the odds on this market we can find out what the betting market thinks (on average) the Remain vote share will be.

At the moment this sub-market looks like this:


We can take the average of the blue and pink numbers for each percentile as estimates of the reciprocal of the cumulative distribution function (CDF) of the vote share. These are quite coarsely spread at 5% intervals, so to get a better idea what the true CDF looks like we can fit a Beta Distribution to these numbers. A Beta Distribution is a general distribution for describing quantities that can take values between 0 and 1, just like the vote share. In R:


x = c(seq(0.4, 0.7, 0.05), 1)#voting percentiles from betfair
iy = c(28.5, 17.5,  5.05, 2.95,  3.83, 11.5, 52.5, 92.5)#betfair odds for each segment
y = 1/iy #Get estimated PDF points from odds
Y = cumsum(y)#get CDF points from PDF
objective_fn <- function(parameters) sum((Y-pbeta(x, parameters[1], parameters[2]))^2) #Create a sqaure error objective to minimise
best_parameters = optim(par=c(1,1), fn = objective_fn) #Get minimising parameters
plot(x, Y, xlab="x", ylab="P(Vote share < x)")
z = seq(0,1, length.out=100)
lines(z, pbeta(z, best_parameters$par[1], best_parameters$par[2]))
print(paste(c("Expected Remain vote: ", best_parameters$par[1]/(best_parameters$par[1]+best_parameters$par[2]) )))

Which gives us an output of Expected Remain vote: 0.53, and the figure below:
We can also plot the probability density function to see how likely any given vote share is:


plot(z, dbeta(z, best_parameters$par[1], best_parameters$par[2]), type="n", xlab="x", ylab="p(Vote=x)")
lines(z, dbeta(z, best_parameters$par[1], best_parameters$par[2]))

to give the figure below, which shows that the predicted Remain vote share is peaked around 0.53, and pretty much symmetrically distributed on either side. 

So the betting market predicts that the vote share for Remain will be 53%, compared to the polls which put it at 50%.  Fitting a Beta Distribution to the data from the market allows us to see what probability the market assigns to any given vote share. We will see in a few days whether the market or the polls are more accurate...

Update 8pm BST June 20. Things have picked up somewhat for the Remain campaign, though uncertainty is still very high. The market currently looks like below, giving a prediction for Remain of: 53.8%± 10.7% (95% CI)


Update 2pm BST June 23. With the polls now open and all opinion polls in there has been a lot of movement on the betting exchanges. Betfair currently give Remain over an 85% chance of victory. With the market looking as below, the expected Remain vote is: 55.5% ± 8.7% (95% CI).

Friday, February 5, 2016

Some thoughts on academic funding

Research costs money, whether it be for buying equipment, compensating drug test subjects or simply to pay the salaries of researchers. Much of the money that funds academic research comes in the form of competitive research grants from a variety of national and supra-national research councils (e.g. EPSRC in the UK, the European Research Council, or the National Science Foudation in the USA), or private foundations (e.g. the Wellcome Trust).

Funding from these bodies is allocated by a competitive process where researchers submit grant applications to the relevant body, describing the project they wish to carry out and justifying the cost. Panels of experts then decide which grants to fund. As well as deciding which research gets done, this also has a profound impact on the academic's career progression as universities depend on the money from these grants to maintain their operations. 

Because of the high importance of these grant awards, many academics in research positions will spend a great deal of time and effort on preparing applications. Universities may support them by allocating them dedicated time for preparation, or by giving them smaller amounts of money to perform preliminary studies which make the full application stronger. Each applicant knows that competing researchers from other universities will be working hard on their applications too, so they must go the extra mile to succeed.

I wondered about the 'deadweight costs' of this process. Time and money spent on applications is time and money that cannot be spent on the research itself. Ultimately we want a system that produces as much excellent research as we can get. Competition may spur academics to do better research, but it is also costing resources that could be devoted to research alone.

We can model this mathematically. Imagine there are two research teams vying to obtain a grant of size G (a typical grant may be a few hundred thousand pounds). Each team can increase its probability of winning the grant by devoting more initial resources to preparation, either in time, salaries, experiments etc. Call the investment of team 1, A and the investment of team 2 B.

A simple model might suggest that the probability of winning the grant is proportional to the initial investment. In that case, for team 1 the probability to win is:

P = A / (A + B)

The expected reward, R, for team 1 is the probability of winning, multiplied by the grant amount, minus the amount invested

R = GP - A
R = GA / (A + B) - A

Now, in order to work out how much team 1 will invest we need to introduce two ideas. The first is a Nash equilibrium. This is a situation where both teams have decided on investments A and B and neither wants to change, i.e. neither can increase their reward by changing. This implies that

dR/dA = 0

which implies that

0 = G/(A+B) - GA/(A+B)2 - 1
0 = GB - (A+B)2

the second idea is symmetry. Since in this simple model both teams are identical, they should come to the same conclusion about how much to spend, so when both teams are 'happy' (at the Nash equilibrium) A = B = X so:

0 = GX - 4X2
0 = G - 4X
X = G/4

so eventually each team will invest one quarter of the grant value into its preparation. One team will be lucky and end up 3G/4 better off, while the other will be G/4 poorer than before.

With two identical teams then the deadweight cost is G/2. This much must be invested by both teams together to decide who gets the final grant. Nothing is produced from this investment, and each team still ends up with a 50% chance of winning the grant.

With more teams one can perform a similar analysis to find that when there are N teams, each will invest G(N-1)/N^2 in the process. So as N becomes large (as it is in most cases), the total deadweight cost will become G(N-1)/N ~ G. In other words, the deadweight costs reach the value of the grant itself. For every £1m the government or private trusts puts on the table to be fought over, another £1m will be wasted in application preparation.

But what if this model isn't correct. Maybe the team that puts in the best application always wins. Maybe it really is worth spending another week, another month of research time on preparation? Well in this case the situation is even worse. The resulting incentives look a lot like a famous hypothetical game called a 'Dollar Auction' (https://en.wikipedia.org/wiki/Dollar_auction). In this game players bid against each other to win a single dollar, with the caveat that everyone must pay their highest bid (just like everyone must pay the cost of their application). Initially bids are low, since bidding a few cents for a dollar seems like a good deal. But once the bids grow over a dollar something strange happens. Players with bids lower than the highest still want to increase their bid, even if it is now more than a dollar, because if they don't win they will lose even more. In such a game the only way to win is not to play!

These are very simple models and reality will be a lot more complex. Applications can be improved and resubmitted. Reviewing applications filters out poorly thought out ideas. But when we consider the effects of competition in science, we should not only see the positive incentive to produce better research, but also the damaging waste that competition over a fixed pool of resources can produce.


Wednesday, January 7, 2015

What we do when we do regressions in social science

The Nobel prize is the most prestigious award a scientist, economist (not really a Nobel prize says every scientist simultaneously), writer or statesman (dubious) can win. As well as conferring enormous status on the recipient, these awards also carry substantial monetary value, both directly and in terms of future earnings. As with any prestigious and lucrative award, we'd like to think that the prizes are given on a purely meritocratic basis. But as we've seen in previous posts, academic selections are rarely free from the suspicion of bias.

Is anyone surprised that a disproportionate number of previous winners have been Swedish? After all, the prizes (except for the peace prize) are awarded by a committee from the Swedish Royal Academy of Science. More glaringly, an overwhelming majority of winners have come from western nations which are culturally similar to Sweden.

So are the Swedes culturally biased? I thought this question would be a good way to demonstrate the basic techniques used to answer such questions in empirical social science, as well as to discuss the problems with these approaches. So here we go...

Lets start by clarifying the hypothesis: The Nobel committee is biased towards awarding prizes to individuals from nations culturally similar to Sweden.

How do we measure cultural similarity? Thankfully the Swedish-founded World Value Survey has toured the world, asking people a series of questions about their values to try and answer this exact question. Their results are broken down into two main axes of values, survival versus self expressive values, and traditional versus secular/rational values (keen observers may note that these terms are somewhat value loaded in themselves!). The results for many countries are shown in the plot below


Conveniently Sweden is placed in the top right of the graph (everyone gasps in surprise). We can approximate the cultural distance between any country and Sweden by the distance separating them on this plot.

I collected data on per-capita Nobel prize awards by nation (data source) for 41 countries, along with their cultural distance from Sweden. The plot below shows that more culturally distant countries are definitely awarded fewer prizes.


So are the Swedes biased then? Not so fast! Of course cultural separation might not be the only force at play here. Western nations are rich and spend a significant proportion of their income on research and development. We'd expect this to yield more and better science, and thus to win more prizes. Sure enough, we see in the plot below that countries with higher research spending do tend to win more prizes (data source).


So what a good paid-up social scientist would do next is to 'control' for research spending before judging if any bias exists. For this we need to do a bit of regression. Lets say that the rate, R, at which individuals from a nation are awarded Nobel prizes is partly due to cultural distance, C, and partly due to spending, S

R = aC + bS 

where a and b are coefficients that express how strong each influence is. Technically what we're going to do is use a Generalized Linear Model with a Poisson distribution to model the number of prizes per 10 million citizens each country receives. With the S factor there, if only research spending is to blame for the disparity of prizes we should find that a is close to zero and statistically not significant. Carrying out a regression like this tells us how likely the correlation of R with C is to be due to random chance, given that R is also correlated with S. When we carry this out in Matlab, (not R stats!), we get highly significant effects for both culture and spending. So a social scientist would say that there is a significant effect of cultural distance on number of prizes, after controlling for research spending.

p-values: (culture: p = 1e-12,  spending: p = 0.2e-8)

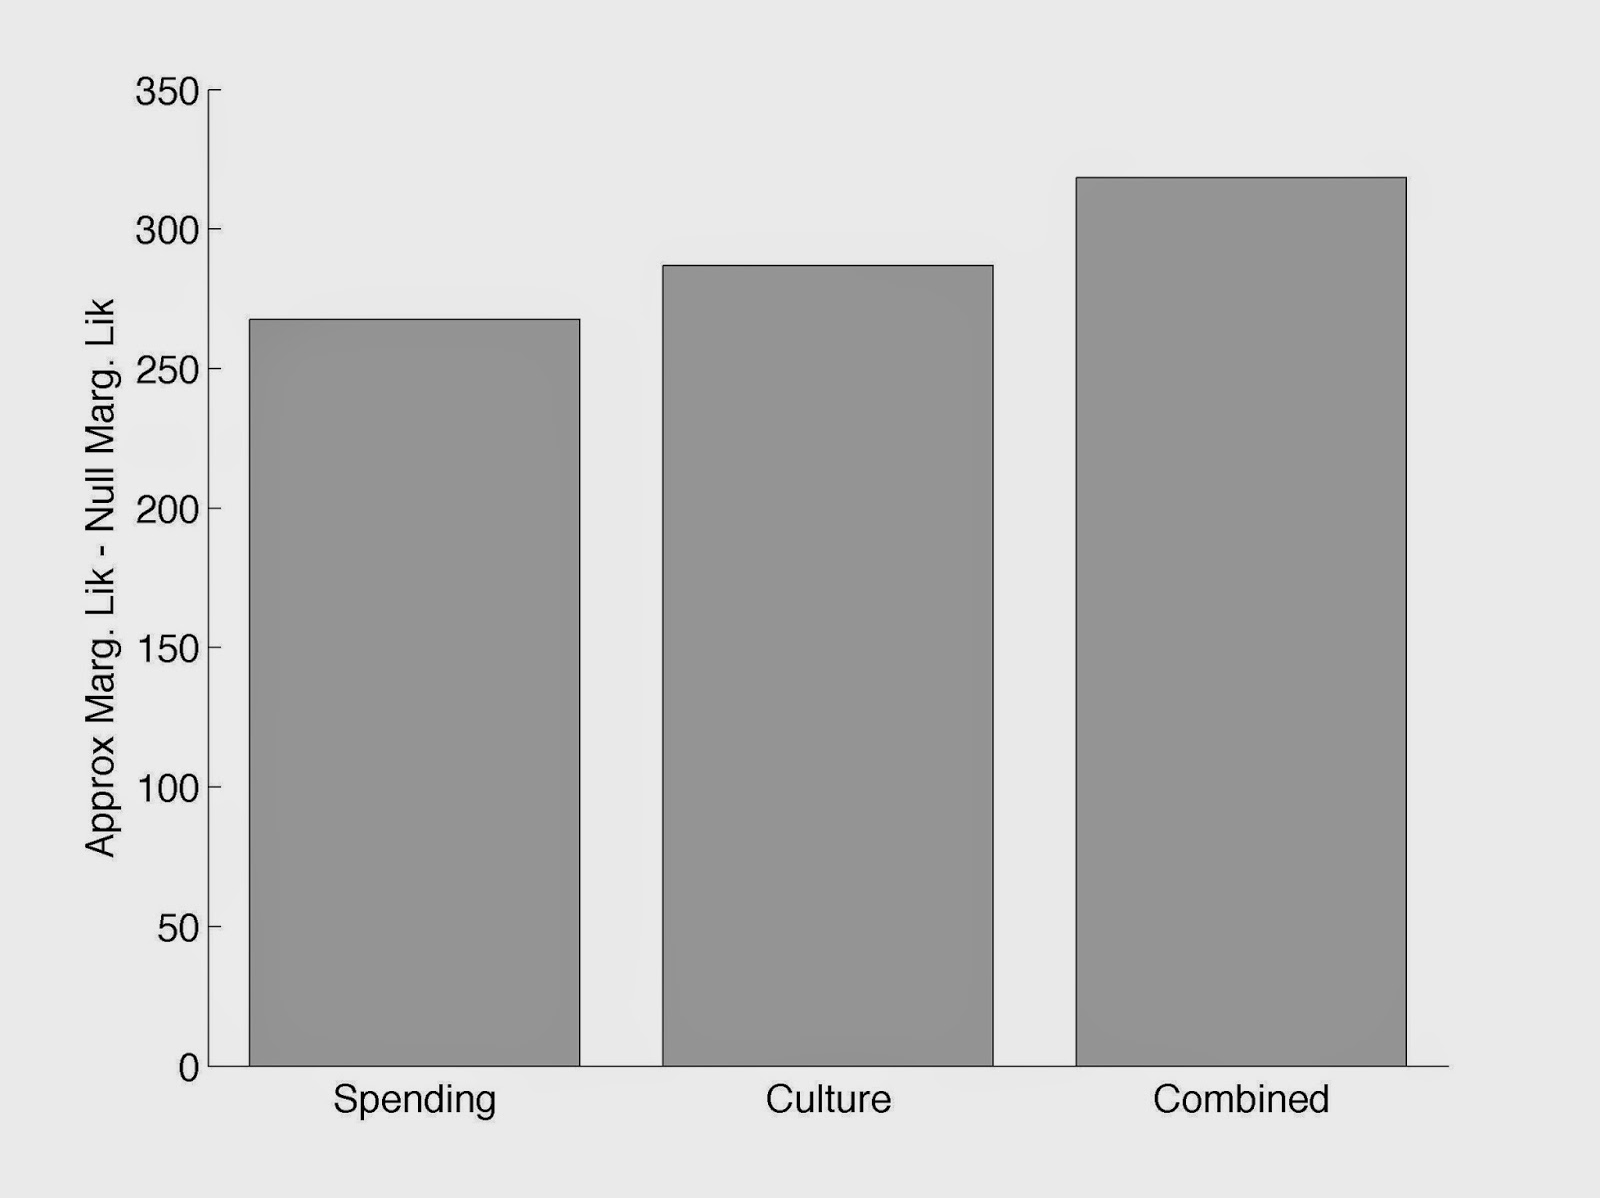
Everyone knows however that p-values suck. A better way to test whether both culture and spending have effects is to do model selection. That is, to see if a model including only culture, only spending or both is best at predicting the data we see. I calculated approximate values of the marginal likelihood of the data for all these 3 models - i.e. the probability of the data, based on each model. Comparing these to a simple null model that prizes are given at the same rate to all countries, we get the results below, again showing that including both effects gives a better prediction than either alone (marginal likelihoods shown in log values).


So surely now we can conclude that the Swedes are biased? Well conclude away...but be prepared to be wrong. Or right. Who knows? Because although this basic procedure (with a little more tweaking and a few more control variables) is ubiquitous in social science, where the observational study is king, it rarely tells us anything conclusively.

On the simplest level, there may well be an additional factor which we haven't controlled for that causes all these apparent effects. Maybe its really cultural distance to the USA that matters. Maybe (God forbid!) Sweden really does produce unusually excellent research. In estimating bias we often assume that fundamentally all nations, genders or whatever category are genuinely equal before any bias kicks in (for example in this previous post). This may be the enlightened thing to do, but it is certainly a strong assumption that we should be aware of.

But beyond these simple problems, there lie deeper issues. What we have just done is a case of Ecological Regression, which, though widely used, is essentially a precise codification of the Ecological Fallacy. For instance, if developing an academic culture, producing highly quality research and winning international science prizes tended to make a country more liberal, richer and more secular and self-expressive, then we'd see exactly the same results, without any need for a bias on the part of the ever fair and impartial Swedish Academy. 

So what can we conclude then? Generally, to be very cautious about over-interpreting correlations, or even significant regression coefficients after controlling for other factors. Causation is a slippery beast, and Ecological Regression won't pin it down for you, no matter how many stories the Daily Mail runs saying that X causes cancer. Is the Swedish Academy biased towards western scientists? I genuinely don't know, and this data won't tell me. I wouldn't be surprised if they were, any more than I'd be surprised if grant awarding agencies were biased in favour of men. But unless someone can do a double blind randomised test, you can continue believing whatever you like about the meritocratic value of our most prestigious prize.

Sunday, May 18, 2014

This is a blog post I wrote about our seminar speaker at IFFS on Friday May 16, mainly for David Sumpter's blog and the IFFS website, but it won't do any harm to post it here as well. I and the speaker, Michael Osborne, did our PhDs together, and now he's one of Oxford's foremost experts on Machine Learning. In this presentation he described how Machine Learning will change everyone's employment in the coming century...

The future of automation


Depending on your perspective, technological development has been saving us from drudgery, or destroying our livelihoods, for centuries. From the very first domestication of animals we’ve been finding ways to perform tasks with less human action since civilisation began.


Last week Dr. Michael Osborne from the University of Oxford gave a presentation at the Institute for Futures Studies showing his predictions about which of us will be losing our jobs in the century to come. Michael, as an expert in Machine Learning, is interested in which jobs will be automated as a result of increasing artificial intelligence in the Big Data era. He and his colleagues have been impressed at the rapid pace with which tasks that were seen as impossible for computers to perform, such as driving a car or translating accurately between different languages have become almost routine.


Machine Learning itself can be used to predict which tasks are ripe for automation. First they gathered data on the skills necessary to perform over 700 different jobs, such as social sensitivity, manual dexterity and creativity. A panel of experts was then asked to predict which of 70 specific jobs would be automatable in the near future. Using Gaussian process regression, Michael and his colleagues learned a relationship between the skills a job requires and the probability that a computer will be able to perform, and extrapolated this relationship to the 700 jobs the panel had not evaluated. Their results give us a view on which sectors of the economy will be most affected by the continued rise of artificial intelligence. The graph below shows, by sector, what proportion of jobs are at low, medium or high risk of being automated. In general, those jobs requiring the most necessary social interactions and/or high level creativity appear to be safest from the coming tide of job losses, but none of us can rest too easy!


Inline images 1


However, we shouldn’t be too distressed at this imminent redundancy. As Michael pointed out for example, while technological progress has reduced the workforce in agriculture from almost 40% of employment in 1900 to around 2% today, the total unemployment rate has barely changed. Technology has allowed society to move human labour to more productive areas. The results of Michael’s analysis also show that it is generally lower paid, lower skilled jobs that will be destroyed, giving hope that people will be able to move into better employment, if society provides them with the necessary skills.

Inline images 2


Nonetheless, Michael also showed examples of resistance to change, such as the guilds of Tudor England blocking the development of machines for making textiles in fear of their members livelihoods. The ever increasing rate of automation, and the subsequent need for people to continually adapt to new careers and find new skills presents society with a powerful challenge, that may require new social contracts, such as a guaranteed citizen’s income and much more investment in public education to solve. It will be exciting to see where this process takes us!